AI has come a long way from just processing text. With its rapid growth, it has now become capable of assisting with data representation by creating AI graphs and charts. Have you ever wondered if there is AI for charts and graphs creation? The answer is a loud yes. AI has made major advances in various fields, and has developed into a potent tool for quickly and professionally creating graphs.
This article will explore the 6 best AI graph generators online. These generators use pseudocodes and algorithms on the backend to swiftly convert raw data into visually captivating graphics, saving you the hassle of manual graph creation.

- On This Page
-
AI Graph Generators Vs. Traditional Ones
-
What Are the Most Practical AI Graph & Chart Generators?
1. GraphMaker: Generate Graphs with AI in a Few Seconds
2. Chartify: Intelligently Convert Your Data into Charts
3. ChatGPT: The Most Powerful AI for Graphs & Charts
4. Google Sheets: The Most Commonly Used AI Graph Generator
5. Microsoft Excel: The Best Offline Graph & Chart Generator
6. MioCreate with a Wide Range of AI-Generated Chart Templates
-
When Do You Need an AI Graph Generator?
3. Simplifying Data Visualization
4. Real-Time Data Analysis
-
Present Your Data More Vividly Than Charts and Graphs
-
FAQs on AI Graph Generator from Text
1. How to maximize AI chart and graph generators?
2. What are the most common types of graphs and charts?
3. Is there an AI that can draw graphs?
AI Graph Generators Vs. Traditional Ones
Is there AI that can make charts and graphs? This is the question most people ask when trying to create graphs quickly using chart AI generators. The short answer to the question is yes.
With the recent advancements in AI, you will see several AI tools helping users create high-quality graphs. What would you choose if given the chance to choose between AI graph generators and traditional graph creation methods? Most people would prefer AI graph generator from text over traditional methods because of the following benefits offered only by AI.
★ Speed and Efficiency. AI-generated charts and graphs save time compared to traditional manual methods.
★ Drawing Hidden Insights. AI can identify patterns and trends in large datasets, offering deeper insights.
★ Intelligent Adaptability. AI intelligently selects the appropriate chart or graph based on the data and user requirements.
Also Read: Free AI Image Generators: Create Images From Text Online >>
What Are the Most Practical AI Graph & Chart Generators?
Various online AI graph makers can help create stunning charts and graphs quickly. Each AI graph generator offers a variety of features that can be helpful for businesses and individuals looking to create high-quality graphs using AI. Let’s take a look at the top 6 of them.
1. GraphMaker: Generate Graphs with AI in a Few Seconds
GraphMaker takes your data, analyzes it with its algorithms, and returns the most suitable chart or graph representation according to the data. GraphMaker gives a wide range of options to choose from. Using GraphMaker, you can make bar graphs, pie charts, scatter plots, line graphs, and much more. Additionally, it allows you to customize the colors and label fonts to create professionally polished visuals.
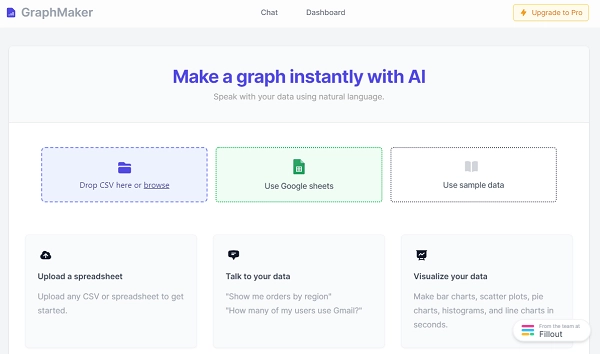
To use GraphMaker, you can upload your dataset from a spreadsheet or any other platform where it is recorded. After uploading the data, you can interact with the graph maker and ask questions about the data. For example, upload a record of students with marks students score in different subjects. After uploading the data, you can ask it to tell you the name of the student who has been an overall high achiever or a student who has been mediocre throughout. You can then convert your data into charts/graphs of your choice.
GraphMaker Pricing:
- Basic (Free).
- Like a Pro ($15/month).
Also Read: Create Perfect AI Collage With the Best AI Collage Makers Online >>
2. Chartify: Intelligently Convert Your Data into Charts
Chartify is another best AI chart generator. It allows its users to import data files or connect to relevant databases from which the data can be fetched. Like GraphMaker, Chartify offers a variety of chart and graph representations and provides customization options to adjust the color and layout of the charts and graphs.
To use Chartify, you must first launch the app and sign up. Then you can upload your dataset, whether a CSV file or connect to Postgres or MySQL. Chartify will then suggest you some visualizations according to your data. You can ask it to visualize your data in the visualization method of your choice.
Chartify Pricing:
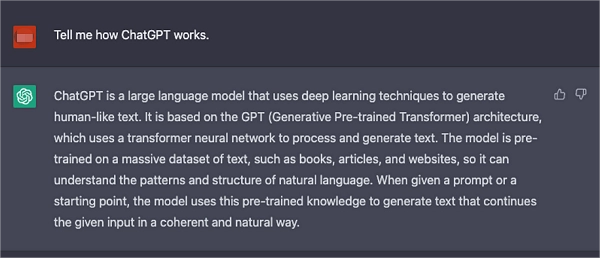
3. ChatGPT: The Most Powerful AI for Graphs & Charts
Another amazing tool for generating graphs and charts is ChatGPT. There are two options to create graphs using ChatGPT. If you have the plus version of ChatGPT, you can launch ChatGPT and open the ChatGPT4 version. Then, click on 'Plugins' and open the Plugin store. From the plugin store, install the plugin named 'Show Me Diagrams' or 'daigr.am'. After this, upload your data (it can be a CSV file, an XLS file, or a file in any other format). Give the prompt to visualize the data in the chart or graph of your choice.
If you are wondering if there is AI that can make charts and graphs on the free version of Chatgpt, then let us tell you a trick for that as well. Simply open ChatGPT, input the data in the prompt, instruct it to make a diagram, graph, or chart from that data, and ask it to output the code in Mermaid. Once you have the code, copy it and open draw.io or any other app that draws graphs and charts. In draw.io, choose a blank diagram, go to arrange, then go to advanced, and then go to Mermaid. Here you will see a code section. Remove the existing code and paste the code copied from ChatGPT, then click on insert. You will have the diagram of your choice ready.
The advantage of using ChatGPT for drawing graphs is that you can ask for explanations and insights from the dataset you conveyed through prompts. Using the plus version, you can also give it directions to make your graph look more visually appealing and colorful.
ChatGPT Pricing:
- Basic (Free).
- Like a Pro ($9.99/month).
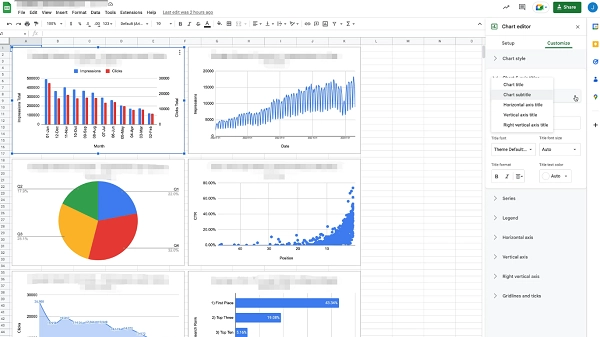
4. Google Sheets: The Most Commonly Used AI Graph Generator
If you are confused about the question "is there AI that can make charts and graphs on Google Sheets", the answer is no. Google Sheets is not an AI-powered tool but uses advanced technology. Thanks to this technology, Google Sheets offers users suggestions for the most suitable graph according to the dataset. To visualize data on Google Sheets, you can select the data you wish to visualize, choose the "insert chart" option, and receive suggestions for suitable chart styles. You can then modify the colors, labels, and fonts per their needs.
Google Sheets Pricing:
- Basic (Free).
- Like a Pro (Different business plans, $6/month at least).
5. Microsoft Excel: The Best Offline Graph & Chart Generator
Another popular graph and chart generator is Microsoft Excel. It is a simple, easy-to-use, and easily accessible tool for creating graphs and charts. It does not require an internet connection to operate, making it convenient for offline use. Excel does an amazing job designing simple and moderately complex graphs and charts. However, it does not support very complex charts and graphs. So, before asking " is there AI that can make charts and graphs", look at the characteristics of Microsoft Excel, which existed long before the arrival of AI.
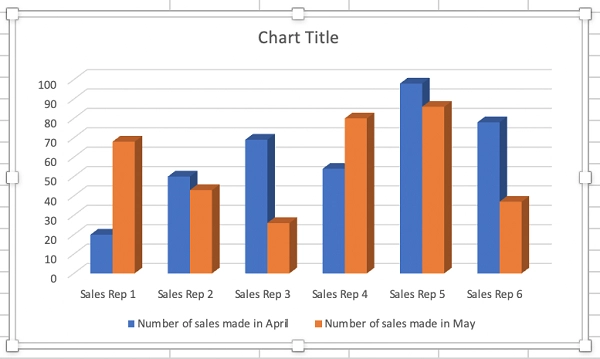
To create a chart or graph in Excel, simply open Microsoft Excel, enter the data in the cells, select the data, and click on "insert." From there, you can choose the type of chart or graph you wish to create. Excel offers a variety of options for charts and graphs to choose from. Additionally, Excel allows changing the chart type after drawing it. You can also customize your chart using elements such as axis, labels, legends, and much more, giving you full control over the appearance and presentation of your data visualization.
Microsoft Excel Pricing:
- Web-based version (Free).
- Like a Pro (Different subscriptions, $5/month at least).
6. MioCreate with a Wide Range of AI-Generated Chart Templates
Like other AI chart generators, MioCreate also simplifies the chart generation process. The unique thing about MioCreate is that it offers different templates for users, featuring a vast collection of AI-generated chart templates. MioCreate operates in a simple way.
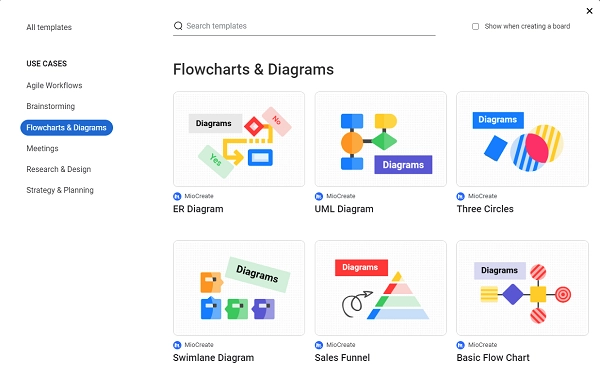
To get started with MioCreate, visit www.miocreate.com and sign up. Then, click on templates and choose the most suitable one. Afterward, you can tweak the template's text, data, arrows, and boxes according to your specific needs.
MioCreate serves multiple purposes, including making diagrams, charts, brainstorming, creating flow charts, UMLs, and much more. Its versatile functionality makes it a valuable tool for various data visualization tasks.
MioCreate Pricing:
- Basic (Free).
- Like a Pro ($4.95/month at least).
When Do You Need an AI Graph Generator?
An AI graph generator from text is a powerful tool that automates the process of creating charts and graphs from data. It is particularly useful for individuals and businesses looking to visualize complex information clearly and visually appealingly. AI generated charts and graphs are indispensable in various scenarios.
1. Large Datasets
Manual graph creation is time-consuming and prone to errors in handling large datasets, while AI graph generators quickly analyze data, generating trends and patterns.
2. Complex Data Patterns
When dealing with non-linear data relationships or complex patterns, AI generators reveal hidden relationships, saving time and effort.
Also Read: Top 5 Best Free AI Image Generators from Text >>
3. Simplifying Data Visualization
AI makes data visualization easier for non-technical individuals who lack graph-drawing expertise, whether they are students presenting research papers or business experts pitching proposals.
4. Real-Time Data Analysis
For experiments requiring real-time data representation, an AI graph generator continuously amends the dataset and graphs, providing up-to-date information and AI graph analysis free.
Present Your Data More Vividly Than Charts and Graphs
Videos are much stronger than graphs and charts for conveying messages. You can represent your data through a video presentation to show attractive details and magnify the effects. A tool that can help you achieve this in minutes is Vidnoz AI, an AI-powered video generator that takes data representation to new heights. It transforms your data into a dynamic video format, allowing you to use prepared video templates and convey complex information through a talking avatar.

Vidnoz AI - Create Free Engaging AI Video with Talking Avatar
- Easily create professional AI videos with realistic avatars.
- Text-to-speech lip sync voices of different languages.
- 2800+ video templates for multiple scenarios.
What Makes Vidnoz AI the Best Solution?
- Lifelike AI Avatars. With Vidnoz AI, you can pick a human avatar that aligns with your brand. All of the Vidnoz AI real-life avatars are generated in a realistic style with natural facial expressions and body movements.
- Human Voices. Vidnoz supports Text-to-speech voice-overs. You can select the voice gender as male or female and determine the voice style, and the avatar can communicate in different languages.
- Video Templates for Charts and Graphs. Over 200+ templates are ready so you can always find a suitable one for your topic and offer AI graph analysis free.
- Free to Use. One of the noteworthy benefits of this application is that it is free, allowing you to create high-quality videos under budget.
Whether you are a business enthusiast, a teacher, a student, or a data analyst, Vidnoz Talking Avatar provides an effective means of making video presentation to represent your data. Just follow the steps to see how.
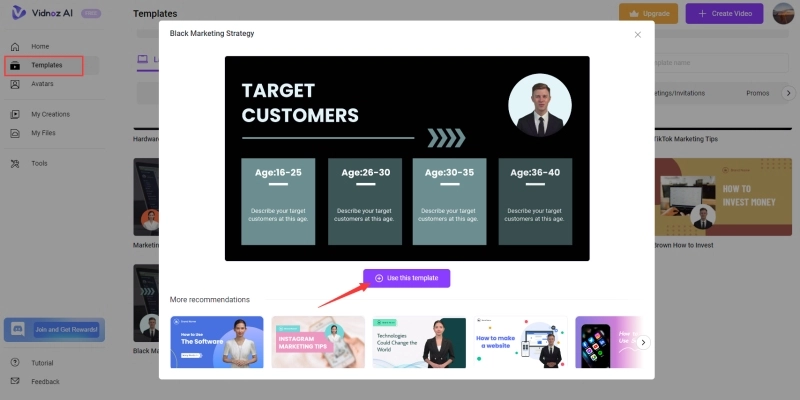
Step 1. Tap the button below to access Vidnoz AI.
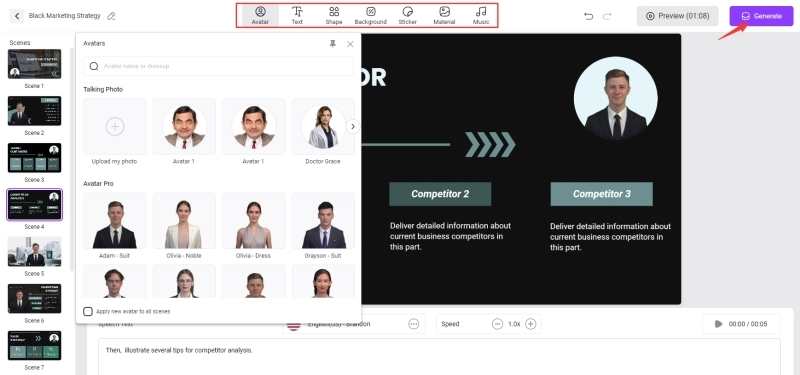
Step 2. Start with a video template, such as Tutorial/How-to and Explainer. On the detailed video page, add your data to the right video scene and customize the video. The built-in video editor includes a wide range of customization options.
Step 3. Enter the voice-over scripts on the Speech box below. Select and adjust the voice of the narrator. You can also change the AI avatar and fine-tune the position of the avatar on the video.
Step 4. Once you’re all set, click Generate in the upper right corner and wait for the video processing to finish. You should get the video creation soon.
FAQs on AI Graph Generator from Text
1. How to maximize AI chart and graph generators?
To take full advantage of AI charts and graph generators to create clear and accurate visualizations, several techniques are available to you: provide specific instructions that clearly explain your intent so that the AI can better understand it; endeavor to customize the generated charts and make any necessary changes; and, finally, choose the appropriate chart style to accurately present the data program.
2. What are the most common types of graphs and charts?
- Pie Chart - Data and statistics can be emphasized in pie slice format.
- Bar Chart - Easy to see and quick to visualize data sets.
- Line Graph - Plots continuous data or data with infinite values.
- Area Graph - Shows values or multiple values over time.
- Scatter plot - Presents relationships between two different variables and data sets.
3. Is there an AI that can draw graphs?
GraphMaker is a chatbot-based graph generator that allows you to generate customized graphics easily. Via its stored data, load file types for AI processing and create stunning personalized graphics effortlessly.
Conclusion
In short, AI has taken data representation to a whole new level. It all began with AI charts and graph generators, freeing us from the time-consuming process of creating charts manually. But now, with the introduction of Vidnoz and other similar tools, data visualization has gone to exceptional heights by immersing us in dynamic and engaging video formats for representing data. The future of data representation undoubtedly holds boundless possibilities, and AI is the main game changer in this exciting journey!
Turn Text into Video with AI - FREE
Generate high-quality videos from PDFs, PPTs, and URLs in one step!